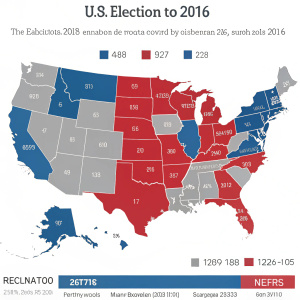
Interactive map displaying US election results from 2008 to 2016. Red, blue, and gray bars indicate voting trends.
PromptInteractive map displaying US election results from 2008 to 2016. Red, blue, and gray bars indicate voting trends.
Raster imageAspect ratio: 1:1
ModelRecraft V3
Get Recraft app for free
Or try all features on desktop
Or try all features on desktop
Create your first image in Recraft
+ Create